# chart
> **说明:**
> 从API version 4开始支持。后续版本如有新增内容,则采用上角标单独标记该内容的起始版本。
图表组件,用于呈现线形图、柱状图、量规图界面。
## 权限列表
无
## 子组件
不支持。
## 属性
除支持[通用属性](js-components-common-attributes.md)外,还支持如下属性:
| 名称 | 类型 | 默认值 | 必填 | 描述 |
| ------------------------------ | ---------------------------------------- | ---- | ---- | ---------------------------------------- |
| type | string | line | 否 | 设置图表类型(不支持动态修改),可选项有:
- bar:柱状图。
- line:线形图。
- gauge:量规图。
- progress5+:进度类圆形图表。
- loading5+:加载类圆形图表。
- rainbow5+:占比类圆形图表。 |
| options | ChartOptions | - | 否 | 图表参数设置,柱状图和线形图必须设置参数设置,量规图不生效。可以设置x轴、y轴的最小值、最大值、刻度数、是否显示,线条宽度、是否平滑等。(不支持动态修改) |
| datasets | Array<ChartDataset> | - | 否 | 数据集合,柱状图和线形图必须设置数据集合,量规图不生效。可以设置多条数据集及其背景色。 |
| segments5+ | DataSegment \| Array<DataSegment> | - | 否 | 进度类、加载类和占比类圆形图表使用的数据结构。
DataSegment针对进度类和加载类圆形图表使用,
Array<DataSegment>针对占比类图标使用,DataSegment最多9个。 |
| effects5+ | boolean | true | 否 | 是否开启占比类、进度类圆形图表特效。 |
| animationduration6+ | number | 3000 | 否 | 设置占比类圆形图表展开动画时长,单位为ms。 |
**表1** ChartOptions
| 名称 | 类型 | 默认值 | 必填 | 描述 |
| ------ | ----------- | ---- | ---- | ---------------------------------------- |
| xAxis | ChartAxis | - | 是 | x轴参数设置。可以设置x轴最小值、最大值、刻度数以及是否显示。 |
| yAxis | ChartAxis | - | 是 | y轴参数设置。可以设置y轴最小值、最大值、刻度数以及是否显示。 |
| series | ChartSeries | - | 否 | 仅线形图支持设置数据序列参数,可以设置的样式:
- 线的样式,如线宽、是否平滑。
- 设置线最前端位置白点的样式和大小。 |
**表2** ChartDataset
| 名称 | 类型 | 默认值 | 必填 | 描述 |
| ----------- | ---------------------------------------- | -------- | ---- | ---------------------- |
| strokeColor | <color> | \#ff6384 | 否 | 仅线形图支持设置线条颜色。 |
| fillColor | <color> | \#ff6384 | 否 | 填充颜色。
线形图表示填充的渐变颜色。 |
| data | Array<number> \| Array<Point>5+ | - | 是 | 设置绘制线或柱中的点集。 |
| gradient | boolean | false | 否 | 仅线形图支持设置是否显示填充渐变颜色。 |
**表3** ChartAxis
| 名称 | 类型 | 默认值 | 必填 | 描述 |
| -------- | ------------- | -------- | ---- | ---------------------------------------- |
| min | number | 0 | 否 | 轴的最小值,仅线形图支持负数。 |
| max | number | 100 | 否 | 轴的最大值,仅线形图支持负数。 |
| axisTick | number | 10 | 否 | 轴显示的刻度数量。仅支持1~20,且具体显示的效果与图的宽度所占的像素/(max-min)有关。
在柱状图中,每组数据显示的柱子数量与刻度数量一致,且柱子显示在刻度处。 |
| display | boolean | false | 否 | 是否显示轴。 |
| color | <color> | \#c0c0c0 | 否 | 轴颜色。 |
**表4** ChartSeries
| 名称 | 类型 | 默认值 | 必填 | 描述 |
| ----------- | -------------- | ---- | ---- | -------------------- |
| lineStyle | ChartLineStyle | - | 否 | 线样式设置,如线宽、是否平滑。 |
| headPoint | PointStyle | - | 否 | 线最前端位置白点的样式和大小。 |
| topPoint | PointStyle | - | 否 | 最高点的样式和大小。 |
| bottomPoint | PointStyle | - | 否 | 最低点的样式和大小。 |
| loop | ChartLoop | - | 否 | 设置屏幕显示满时,是否需要重头开始绘制。 |
**表5** ChartLineStyle
| 名称 | 类型 | 默认值 | 必填 | 描述 |
| ------ | -------------- | ----- | ---- | ----- |
| width | <length> | 1px | 否 | 线宽设置。 |
| smooth | boolean | false | 否 | 是否平滑。 |
**表6** PointStyle
| 名称 | 类型 | 默认值 | 必填 | 描述 |
| ----------- | -------------- | -------- | ---- | ---------------------------------------- |
| shape | string | circle | 否 | 高亮点的形状。可选值为:
- circle:圆形。
- square:方形。
- triangle:三角形。 |
| size | <length> | 5px | 否 | 高亮点的大小。 |
| strokeWidth | <length> | 1px | 否 | 边框宽度 |
| strokeColor | <color> | \#ff0000 | 否 | 边框颜色。 |
| fillColor | <color> | \#ff0000 | 否 | 填充颜色。 |
**表7** ChartLoop
| 名称 | 类型 | 默认值 | 必填 | 描述 |
| -------- | -------------- | ----- | ---- | ---------------------------------------- |
| margin | <length> | 1 | 否 | 擦除点的个数(最新绘制的点与最老的点之间的横向距离)。轻量设备margin和topPoint/bottomPoint/headPoint同时使用时,有概率出现point正好位于擦除区域的情况,导致point不可见,因此不建议同时使用。 |
| gradient | boolean | false | 否 | 是否需要渐变擦除。 |
**表8** Point5+
| 名称 | 类型 | 默认值 | 必填 | 描述 |
| ------------ | ------------- | -------- | ---- | ---------------------------------------- |
| value | number | 0 | 是 | 表示绘制点的Y轴坐标。 |
| pointStyle | PointStyle | - | 否 | 表示当前数据点的绘制样式。 |
| description | string | - | 否 | 表示当前点的注释内容。 |
| textLocation | string | - | 否 | 可选值为top,bottom,none。分别表示注释的绘制位置位于点的上方,下方,以及不绘制。 |
| textColor | <color> | \#000000 | 否 | 表示注释文字的颜色。 |
| lineDash | string | solid | 否 | 表示绘制当前线段虚线的样式。“dashed, 5, 5”表示纯虚线,绘制5px的实线后留5px的空白。“solid”表示绘制实线。 |
| lineColor | <color> | \#000000 | 否 | 表示绘制当前线段的颜色。此颜色不设置会默认使用整体的strokeColor。 |
**表9** DataSegment5+
| 名称 | 类型 | 默认值 | 必填 | 描述 |
| ---------- | ------ | ---- | ---- | ---------------------------------------- |
| startColor | Color | - | 否 | 起始位置的颜色,设置startColor必须设置endColor。不设置startColor时,会使用系统默认预置的颜色数组,具体颜色值见下表。 |
| endColor | Color | - | 否 | 终止位置的颜色,设置endColor必须设置startColor。
不设置startColor时,会使用系统默认预置的颜色数组。 |
| value | number | 0 | 是 | 占比数据的所占份额,最大100。 |
| name | string | - | 否 | 此类数据的名称。 |
| 数据组 | 浅色主题 | 深色主题 |
| ---- | --------------------------- | --------------------------- |
| 0 | 起始颜色:\#f7ce00,结束颜色:\#f99b11 | 起始颜色:\#d1a738,结束颜色:\#eb933d |
| 1 | 起始颜色:\#f76223,结束颜色:\#f2400a | 起始颜色:\#e67d50,结束颜色:\#d9542b |
| 2 | 起始颜色:\#f772ac,结束颜色:\#e65392 | 起始颜色:\#d5749e,结束颜色:\#d6568d |
| 3 | 起始颜色:\#a575eb,结束颜色:\#a12df7 | 起始颜色:\#9973d1,结束颜色:\#5552d9 |
| 4 | 起始颜色:\#7b79f7,结束颜色:\#4b48f7 | 起始颜色:\#7977d9,结束颜色:\#f99b11 |
| 5 | 起始颜色:\#4b8af3,结束颜色:\#007dff | 起始颜色:\#4c81d9,结束颜色:\#217bd9 |
| 6 | 起始颜色:\#73c1e6,结束颜色:\#4fb4e3 | 起始颜色:\#5ea6d1,结束颜色:\#4895c2 |
| 7 | 起始颜色:\#a5d61d,结束颜色:\#69d14f | 起始颜色:\#91c23a,结束颜色:\#70ba5d |
| 8 | 起始颜色:\#a2a2b0,结束颜色:\#8e8e93 | 起始颜色:\#8c8c99,结束颜色:\#6b6b76 |
当类型为量规图时,还支持如下属性:
| 名称 | 类型 | 默认值 | 必填 | 描述 |
| ------- | ------ | ---- | ---- | ---------------------- |
| percent | number | 0 | 否 | 当前值占整体的百分比,取值范围为0-100。 |
## 样式
除支持[通用样式](js-components-common-styles.md)外,还支持如下样式:
| 名称 | 类型 | 默认值 | 必填 | 描述 |
| ------------------------ | -------------- | -------------------------- | ---- | ---------------------------------------- |
| stroke-width | <length> | 32px(量规)
24px(占比类圆形图表) | 否 | 量规、占比类圆形图表组件刻度条的宽度。 |
| start-angle | <deg> | 240(量规)
0(占比类圆形图表) | 否 | 量规、占比类圆形图表组件刻度条起始角度,以时钟0点为基线。范围为0到360。 |
| total-angle | <deg> | 240(量规)
360(占比类圆形图表) | 否 | 量规、占比类圆形图表组件刻度条总长度,范围为-360到360,负数标识起点到终点为逆时针。 |
| center-x | <length> | - | 否 | 量规组件刻度条中心位置,该样式优先于通用样式的position样式。该样式需要和center-y和radius一起配置才能生效。(仅量规图支持) |
| center-y | <length> | - | 否 | 量规组件刻度条中心位置,该样式优先于通用样式的position样式。该样式需要和center-x和radius一起配置才能生效。(仅量规图支持) |
| radius | <length> | - | 否 | 量规组件刻度条半径,该样式优先于通用样式的width和height样式。该样式需要和center-x和center-y一起配置才能生效。(仅量规图支持) |
| colors | Array | - | 否 | 量规组件刻度条每一个区段的颜色。
如:colors: \#ff0000, \#00ff00。(仅量规图支持) |
| weights | Array | - | 否 | 量规组件刻度条每一个区段的权重。
如:weights: 2, 2。(仅量规图支持) |
| font-family5+ | Array | - | 否 | 表示绘制注释的字体样式,支持[自定义字体](js-components-common-customizing-font.md)。 |
| font-size5+ | <length> | - | 否 | 表示绘制注释的字体的大小。 |
## 事件
支持[通用事件](js-components-common-events.md)。
## 方法
除支持[通用方法](js-components-common-methods.md)外,还支持如下方法:
| 方法 | 参数 | 描述 |
| ------ | ---------------------------------------- | ---------------------------------------- |
| append | {
serial: number,
data: Array<number>,
} | 向已有的数据序列中动态添加数据,根据serial指定目标序列,serial为datasets数组的下标,从0开始。假设serial的值为index,使用data数据更新datasets[index].data。仅线形图支持,按横坐标加1递增(与xAxis min/max设置相关)。 |
## 示例
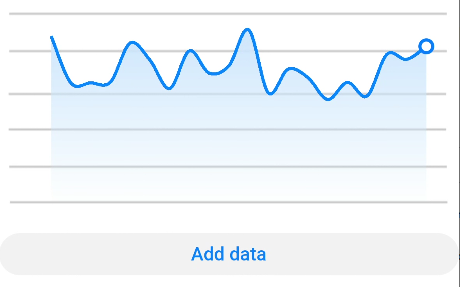
1. 线形图
```html
```
```css
/* xxx.css */
.container {
flex-direction: column;
justify-content: center;
align-items: center;
}
.chart-region {
height: 400px;
width: 700px;
}
.chart-background {
object-fit: fill;
}
.chart-data {
width: 700px;
height: 600px;
}
button {
width: 100%;
height: 50px;
background-color: #F4F2F1;
text-color: #0C81F3;
}
```
```js
// xxx.js
export default {
data: {
lineData: [
{
strokeColor: '#0081ff',
fillColor: '#cce5ff',
data: [763, 550, 551, 554, 731, 654, 525, 696, 595, 628, 791, 505, 613, 575, 475, 553, 491, 680, 657, 716],
gradient: true
}
],
lineOps: {
xAxis: {
min: 0,
max: 20,
display: false
},
yAxis: {
min: 0,
max: 1000,
display: false
},
series: {
lineStyle: {
width: "5px",
smooth: true
},
headPoint: {
shape: "circle",
size: 20,
strokeWidth: 5,
fillColor: '#ffffff',
strokeColor: '#007aff',
display: true
},
loop: {
margin: 2,
gradient: true
}
}
}
},
addData() {
this.$refs.linechart.append({
serial: 0,
data: [Math.floor(Math.random() * 400) + 400]
})
}
}
```
2. 柱状图
```html
```
```css
/* xxx.css */
.container {
flex-direction: column;
justify-content: center;
align-items: center;
}
.data-region {
height: 400px;
width: 700px;
}
.data-background {
object-fit: fill;
}
.data-bar {
width: 700px;
height: 400px;
}
```
```js
// xxx.js
export default {
data: {
barData: [
{
fillColor: '#f07826',
data: [763, 550, 551, 554, 731, 654, 525, 696, 595, 628]
},
{
fillColor: '#cce5ff',
data: [535, 776, 615, 444, 694, 785, 677, 609, 562, 410]
},
{
fillColor: '#ff88bb',
data: [673, 500, 574, 483, 702, 583, 437, 506, 693, 657]
},
],
barOps: {
xAxis: {
min: 0,
max: 20,
display: false,
axisTick: 10
},
yAxis: {
min: 0,
max: 1000,
display: false
}
}
}
}
```

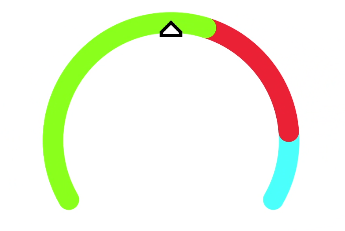
3. 量规图
```html
```
```css
/* xxx.css */
.container {
flex-direction: column;
justify-content: center;
align-items: center;
}
.gauge-region {
height: 400px;
width: 400px;
}
.data-gauge {
colors: #83f115, #fd3636, #3bf8ff;
weights: 4, 2, 1;
}
```
4. 进度类、加载类、占比类圆形图表
```html
progress Example
loading Example
rainbow Example
```
```css
/* xxx.css */
.container {
flex-direction: column;
justify-content: center;
align-items: center;
}
.chart-region {
height: 400px;
width: 700px;
margin-top: 10px;
}
.text {
margin-top: 30px;
}
```
```js
// xxx.js
export default {
data: {
progressdata: {
value: 50,
name: 'progress'
},
loadingdata: {
startColor: "#ffc0cb",
endColor: "#00bfff",
},
rainbowdata: [
{
value: 50,
name: 'item1'
},
{
value: 10,
name: 'item2'
},
{
value: 20,
name: 'item3'
},
{
value: 10,
name: 'item4'
},
{
value: 10,
name: 'item5'
}
]
}
}
```
