# chartå¼€å‘指导
chart为图表组件,用于呈现线形图ã€æŸ±çŠ¶å›¾å’Œé‡è§„图界é¢ã€‚具体用法请å‚考[chart](../reference/apis-arkui/arkui-js/js-components-basic-chart.md)。
## 创建chart组件
在pages/index目录下的hml文件ä¸åˆ›å»ºä¸€ä¸ªchart组件。
```html
<!-- xxx.hml -->
<div class="container">
<chart class="chart-data" type="line" options="{{lineOps}}" datasets="{{lineData}}"></chart>
</div>
```
```css
/* xxx.css */
.container {
width: 100%;
height: 100%;
flex-direction: column;
justify-content: center;
align-items: center;
background-color: #F1F3F5;
}
.chart-data {
width: 700px;
height: 600px;
}
```
```js
// xxx.js
export default {
data: {
lineData: [
{
data: [763, 550, 551, 554, 731, 654, 525, 696, 595, 628, 791, 505, 613, 575, 475, 553, 491, 680, 657, 716]
}
],
lineOps: {
xAxis: {
min: 0,
max: 20,
display: false,
},
yAxis: {
min: 0,
max: 1000,
display: false,
},
series: {
lineStyle: {
width: 15,
},
}
},
}
}
```
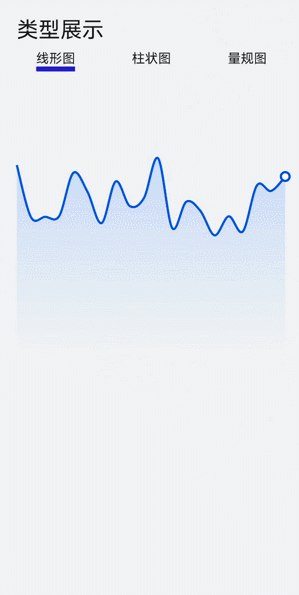
## 设置图表类型
chart组件通过设置type属性定义图表类型,如将图表设置为柱状图。
```html
<!-- xxx.hml -->
<div class="container">
<div class="container">
<div class="switch-block">
<text class="title">
{{ title }}
</text>
</div>
<tabs class="tabs" index="0" vertical="false" onchange="changes">
<tab-content class="tabcontent" scrollable="true">
<tabs >
<tab-bar class="tab-bar" mode="fixed"style="margin-bottom: 50px;">
<text class="tab-text">线形图</text>
<text class="tab-text">柱状图</text>
<text class="tab-text">é‡è§„图</text>
</tab-bar>
<tab-content>
<div class="bar-block" style="margin-left: 30px;">
<chart class="chart-data" type="line" ref="linechart" options="{{ lineOps }}" datasets="{{ lineData }}">
</chart>
</div>
<div class="bar-block">
<chart class="data-bar" type="bar" id="bar-chart" options="{{ barOps }}" datasets="{{ barData }}">
</chart>
</div>
<div class="chart-block">
<chart type="gauge" ></chart>
</div>
</tab-content>
</tabs>
</tab-content>
</tabs>
</div>
</div>
```
```css
/* xxx.css */
.container {
width: 100%;
height: 100%;
flex-direction: column;
justify-content: center;
background-color: #F1F3F5;
}
.tab-bar{
background-color: #F1F3F5;
}
.chart-data {
width: 700px;
height: 600px;
}
.title{
margin-left: 50px;
margin-top: 50px;
font-size: 50px;
}
.line-block{
align-items: center;
justify-content: center;
}
.bar-block{
align-items: center;
justify-content: center;
}
.chart-block{
width: 90%;
margin-left: 30px;
}
```
```js
// xxx.js
export default {
data: {
title: "类型展示",
barData: [
{
fillColor: '#3848e8',
data: [763, 550, 551, 554, 731, 654, 525, 696, 595],
}
],
lineData: [
{
strokeColor: '#0081ff',
fillColor: '#cce5ff',
data: [763, 550, 551, 554, 731, 654, 525, 696, 595, 628, 791, 505, 613, 575, 475, 553, 491, 680, 657, 716],
gradient: true,
}
],
lineOps: {
xAxis: {
min: 0,
max: 20,
display: false,
},
yAxis: {
min: 0,
max: 1000,
display: false,
},
series:{
lineStyle: {
width: "5px",
smooth: true,
},
headPoint: {
shape:"circle",
size: 20,
strokeWidth: 5,
fillColor: '#ffffff',
strokeColor: '#007aff',
display: true,
},
loop:{
margin: 2,
gradient: true
}
},
},
barOps: {
xAxis: {
min: 0,
max: 20,
display: false,
axisTick: 10,
},
yAxis: {
min: 0,
max: 1000,
},
},
},
}
```
> **说明:**
>
> chartä¸æ”¯æŒæ˜¾ç¤ºæ¯ä¸ªç‚¹çš„值。
## 设置图表属性
chart组件在options属性ä¸è®¾ç½®å¯¹xè½´ã€y轴和数æ®åºåˆ—å‚数的设置,在datasetså±žæ€§é‡Œæ·»åŠ å¯¹çº¿æ¡é¢œè‰²ã€å¡«å……颜色ã€å¡«å……æ¸å˜é¢œè‰²å’Œç»˜åˆ¶ç‚¹é›†çš„设置。
```html
<!-- xxx.hml -->
<div class="container">
<chart class="chart-data" type="line" options="{{lineOps}}" datasets="{{lineData}}"></chart>
</div>
```
```css
/* xxx.css */
.container {
width: 100%;
height: 100%;
flex-direction: column;
justify-content: center;
align-items: center;
background-color: #F1F3F5;
}
.chart-data {
width: 700px;
height: 600px;
}
```
```js
// xxx.js
export default {
data: {
//线形图数æ®
lineData: [
{
strokeColor: '#0081ff',
fillColor: '#cce5ff', //填充色
data: [463, 250, 251, 254, 431, 354, 225, 396, 295, 328, 491, 205, 313, 275, 475, 553, 491, 380, 357, 416],
gradient: true,
}
],
lineOps: {
//xè½´å‚数设置
xAxis: {
min: 0,
max: 20,
display: false,
},
//yè½´å‚数设置
yAxis: {
min: 0,
max: 1000,
display: false,
},
//æ•°æ®åºåˆ—å‚数设置
series: {
//çº¿æ ·å¼è®¾ç½®
lineStyle: {
width: "5px",
smooth: true,
},
//线最å‰ç«¯ä½ç½®ç™½ç‚¹çš„æ ·å¼å’Œå¤§å°
headPoint: {
shape: "circle",
size: 20,
strokeWidth: 5,
fillColor: '#ffffff',
strokeColor: '#007aff',
display: true,
},
//设置å±å¹•æ˜¾ç¤ºæ»¡æ—¶ï¼Œæ˜¯å¦éœ€è¦é‡å¤´å¼€å§‹ç»˜åˆ¶
loop: {
margin: 2,
gradient: true
}
}
},
},
}
```
> **说明:**
> - optionsåªæ”¯æŒæŸ±çŠ¶å›¾å’Œçº¿å½¢å›¾è®¾ç½®å‚数,é‡è§„图ä¸ç”Ÿæ•ˆã€‚
>
> - datasetsåªæ”¯æŒæŸ±çŠ¶å›¾å’Œçº¿å½¢å›¾è®¾ç½®æ•°æ®é›†åˆï¼Œé‡è§„图ä¸ç”Ÿæ•ˆã€‚
>
> - seriesåªæœ‰çº¿å½¢å›¾æ”¯æŒã€‚
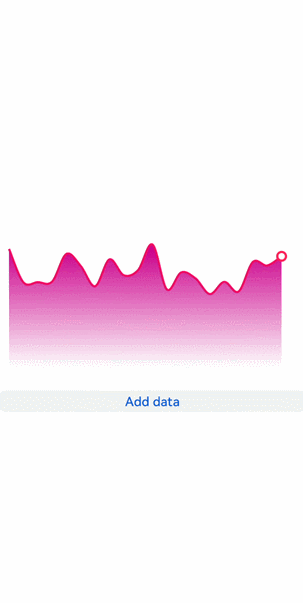
## æ·»åŠ æ•°æ®
通过chart组件的append方法,实现动æ€æ·»åŠ æ•°æ®ã€‚
```html
<!-- xxx.hml -->
<div class="container">
<stack class="chart-region">
<chart class="chart-data" type="line" ref="linechart" options="{{lineOps}}" datasets="{{lineData}}"></chart>
</stack>
<button value="Add data" onclick="addData"></button>
</div>
```
```css
/* xxx.css */
.container {
flex-direction: column;
justify-content: center;
align-items: center;
background-color: #F1F3F5;
}
.chart-region {
height: 400px;
width: 700px;
}
.chart-data {
width: 700px;
height: 600px;
}
button {
width: 100%;
height: 50px;
background-color: #F4F2F1;
text-color: #0C81F3;
margin-top: 30px;
}
```
```js
// xxx.js
export default {
data: {
lineData: [
{
strokeColor: '#de0b6e',
fillColor: '#bb09a3',
data: [763, 550, 551, 554, 731, 654, 525, 696, 595, 628, 791, 505, 613, 575, 475, 553, 491, 680, 657, 716],
gradient: true,
}
],
lineOps: {
xAxis: {
min: 0,
max: 20,
display: false,
},
yAxis: {
min: 0,
max: 1000,
display: false,
},
series: {
lineStyle: {
width: "5px",
smooth: true,
},
headPoint: {
shape: "circle",
size: 20,
strokeWidth: 5,
fillColor: '#ffffff',
strokeColor: '#f8145c',
display: true,
},
loop: {
margin: 2,
gradient: true,
}
}
},
},
addData() {
this.$refs.linechart.append({
serial: 0,
data: [Math.floor(Math.random() * 400) + 200]
})
}
}
```
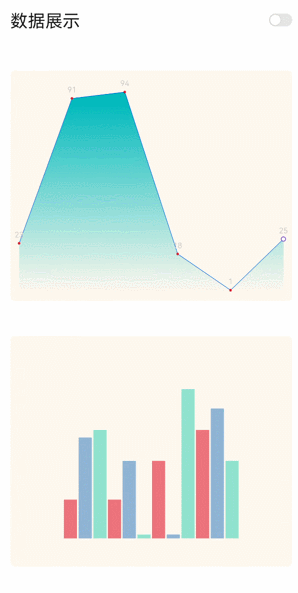
## 场景示例
å¼€å‘者å¯ä»¥æ ¹æ®å¼€å…³Switch的状æ€æ¥é€‰æ‹©æ•°æ®å±•ç¤ºçš„状æ€ï¼Œå½“Switch状æ€ä¸ºtrue时,通过定时器æ¥å®žçŽ°æ•°æ®çš„动æ€å±•ç¤ºã€‚
```html
<!-- xxx.hml -->
<div class="container">
<div class="container">
<div class="switch-block">
<text class="title">{{ title }} </text>
<switch class="switch" showtext="{{ showText }}" allow-scale="{{ allowScale }}"onchange="change">
</switch>
</div>
<tabs class="tabs" index="0" vertical="false" onchange="changes">
<tab-content class="tabcontent" scrollable="true">
<div>
<tabs class="tabs" index="0" vertical="false" onchange="changes">
<tab-content class="tabcontent" scrollable="true">
<div class="line-class">
<div class="bar-block">
<chart class="chart-data" type="line" ref="linechart" options="{{ lineOps }}"
datasets="{{ lineData }}">
</chart>
</div>
<div class="bar-block">
<chart class="data-bar" type="bar" id="bar-chart" options="{{ barOps }}"datasets="{{ barData }}">
</chart>
</div>
</div>
</tab-content>
</tabs>
</div>
<div>
<div class="container">
<list class="todo-wrapper">
<list-item for="{{ barData }}" class="todo-item">
<text class="todo-title">{{ $item.data }}</text>
</list-item>
</list>
<list class="todo-wrapper">
<list-item for="{{ lineData.data }}" class="todo-item">
<text class="todo-title">{{ $item.value }}</text>
</list-item>
</list>
</div>
</div>
</tab-content>
</tabs>
</div>
</div>
```
```css
/* xxx.css */
.container{
display:flex;
flex-direction:column;
background-color: #F1F3F5;
}
.line-class{
display: flex;
flex-direction: column;
}
.title{
font-size: 40px;
margin-left: 40px;
}
.switch-block {
margin-top: 30px;
width: 98%;
height: 80px;
display: flex;
justify-content: space-between;
}
.switch{
font-size: 40px;
}
.bar-block {
margin-top: 80px;
margin-left: 40px;
position: relative;
width: 90%;
border-radius: 10px;
background-color: #25FAB27B;
height: 40%;
justify-content: center;
}
```
```js
// xxx.js
export default {
data: {
interval: null,
title: "æ•°æ®å±•ç¤º",
allowScale: true,
dataLength: 30,
barGroup: 3,
lineData: null,
lineOps: {
xAxis: {
min: 0,
max: 5
},
yAxis: {
min: 0,
max: 100
},
series: {
lineStyle: {
width: '1px',
},
headPoint: {
shape: 'circle',
size: 10,
strokeWidth: 2,
fillColor: '#ffffff',
strokeColor: '#8477DF'
},
loop: {
margin: 2
}
}
},
barData: [
{
fillColor: '#97CF0A2C',
data: [20, 20,40, 56]
},
{
fillColor: '#6D0A7ACF',
data: [52, 40, 2, 67]
},
{
fillColor: '#6A0ACFA1',
data: [56, 2, 77, 40]
}
],
barOps: {
xAxis: {
min: 0,
max: 20,
axisTick: 5
},
yAxis: {
min: 0,
max: 100
}
}
},
onInit() {
this.changeLine();
},
change(e) {
if (e.checked) {
this.interval = setInterval(() => {
this.changeLine();
this.changeBar();
}, 1000)
} else {
clearInterval(this.interval);
}
},
changeLine() {
var dataArray = [];
for (var i = 0; i < this.dataLength; i++) {
var nowValue = Math.floor(Math.random() * 99 + 1);
var obj = {
"value": nowValue,
"description": nowValue + "",
"textLocation": "top",
"textColor": "#CDCACA",
"pointStyle": {
"shape": "circle",
"size": 5,
"fillColor": "#CF0A2C",
"strokeColor": "#CF0A2C"
}
};
dataArray.push(obj);
}
this.lineData = [
{
strokeColor: '#0081ff',
fillColor: '#FF07CDC4',
data: dataArray,
gradient: true,
}
]
},
changeBar() {
for (var i = 0;i < this.barGroup; i++) {
var dataArray = this.barData[i].data;
for (var j = 0;j < 4; j++) {
dataArray[j] = Math.floor(Math.random() * 99 + 1);
}
}
this.barData = this.barData.splice(0, this.barGroup + 1);
},
changes(e) {
console.log("Tab index: " + e.index);
},
}
```