# 使用DevTools工具调试å‰ç«¯é¡µé¢
Web组件支æŒä½¿ç”¨DevTools工具调试å‰ç«¯é¡µé¢ã€‚DevTools是一个 Webå‰ç«¯å¼€å‘调试工具,æ供了电脑上调试移动设备å‰ç«¯é¡µé¢çš„能力。开å‘者通过[setWebDebuggingAccess()](../reference/apis-arkweb/js-apis-webview.md#setwebdebuggingaccess)接å£å¼€å¯Web组件å‰ç«¯é¡µé¢è°ƒè¯•èƒ½åŠ›ï¼Œåˆ©ç”¨DevTools工具å¯ä»¥åœ¨ç”µè„‘上调试移动设备上的å‰ç«¯ç½‘页,设备需为4.1.0åŠä»¥ä¸Šç‰ˆæœ¬ã€‚
## 调试æ¥éª¤
### 应用代ç å¼€å¯Web调试开关
调试网页å‰ï¼Œéœ€è¦åº”用侧代ç 调用[setWebDebuggingAccess()](../reference/apis-arkweb/js-apis-webview.md#setwebdebuggingaccess)接å£å¼€å¯Web调试开关。
如果没有开å¯Web调试开关,则DevToolsæ— æ³•å‘现被调试的网页。
1. 在应用代ç ä¸å¼€å¯Web调试开关,具体如下:
```ts
// xxx.ets
import { webview } from '@kit.ArkWeb';
@Entry
@Component
struct WebComponent {
controller: webview.WebviewController = new webview.WebviewController();
aboutToAppear() {
// é…ç½®Webå¼€å¯è°ƒè¯•æ¨¡å¼
webview.WebviewController.setWebDebuggingAccess(true);
}
build() {
Column() {
Web({ src: 'www.example.com', controller: this.controller })
}
}
}
```
2. å¼€å¯è°ƒè¯•åŠŸèƒ½éœ€è¦åœ¨DevEco Studio应用工程hap模å—çš„module.json5文件ä¸å¢žåŠ 如下æƒé™ï¼Œæ·»åŠ 方法请å‚考[在é…置文件ä¸å£°æ˜Žæƒé™](../security/AccessToken/declare-permissions.md)。
```
"requestPermissions":[
{
"name" : "ohos.permission.INTERNET"
}
]
```
### 将设备连接至电脑
请将设备连接至电脑,éšåŽå¼€å¯å¼€å‘者模å¼ï¼Œä¸ºåŽç»çš„端å£è½¬å‘æ“作åšå¥½å‡†å¤‡ã€‚
1. 请开å¯è®¾å¤‡ä¸Šçš„å¼€å‘者模å¼ï¼Œå¹¶å¯ç”¨USB调试功能。
(1) 终端系统查看“设置 > 系统â€ä¸æ˜¯å¦æœ‰â€œå¼€å‘者选项â€ï¼Œå¦‚æžœä¸å˜åœ¨ï¼Œå¯åœ¨â€œè®¾ç½® > 关于本机â€è¿žç»ä¸ƒæ¬¡å•å‡»â€œç‰ˆæœ¬å·â€ï¼Œç›´åˆ°æ示“开å¯å¼€å‘者模å¼â€ï¼Œç‚¹å‡»â€œç¡®è®¤å¼€å¯â€åŽè¾“å…¥PINç (如果已设置),设备将自动é‡å¯ã€‚
(2) USBæ•°æ®çº¿è¿žæŽ¥ç»ˆç«¯å’Œç”µè„‘,在“设置 > 系统 > å¼€å‘者选项â€ä¸ï¼Œæ‰“开“USB调试â€å¼€å…³ï¼Œå¼¹å‡ºçš„“å…许USB调试â€çš„弹框,点击“å…许â€ã€‚
2. 使用hdc命令连接上设备。
打开命令行执行如下命令,查看hdc能å¦å‘现设备。
```shell
hdc list targets
```
- 如果命令有返回设备的ID,则说明hdc已连接上设备。

- 如果命令返回 `[Empty]`,则说明hdc还没有å‘现设备。

3. 进入hdc shell。
当hdc命令连接上设备åŽï¼Œæ‰§è¡Œå¦‚下命令,进入hdc shell。
```shell
hdc shell
```
### 端å£è½¬å‘
当应用代ç 调用setWebDebuggingAccess接å£å¼€å¯Web调试开关åŽï¼ŒArkWebå†…æ ¸å°†å¯åŠ¨ä¸€ä¸ªdomain socket的监å¬ï¼Œä»¥æ¤å®žçŽ°DevTools对网页的调试功能。
但是Chromeæµè§ˆå™¨æ— 法直接访问到设备上的domain socket, 所以需è¦å°†è®¾å¤‡ä¸Šçš„domain socket转å‘到电脑上。
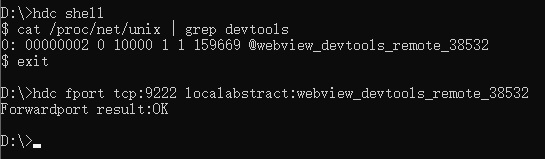
1. 先在hdc shell里执行如下命令,查询ArkWeb在设备里创建的domain socket。
```shell
cat /proc/net/unix | grep devtools
```
* 如果å‰å‡ æ¥æ“ä½œæ— è¯¯ï¼Œè¯¥å‘½ä»¤çš„æ‰§è¡Œç»“æžœå°†æ˜¾ç¤ºç”¨äºŽæŸ¥è¯¢çš„domain socket端å£ã€‚

* 如果没有查询到结果, 请å†æ¬¡ç¡®è®¤ã€‚
(1) 应用开å¯äº†Web调试开关。
(2) 应用使用Webç»„ä»¶åŠ è½½äº†ç½‘é¡µã€‚
2. 将查询到的domain socket转å‘至电脑的TCP 9222端å£ã€‚
退出hdc shell,在命令行里执行如下命令转å‘端å£ã€‚
```shell
hdc fport tcp:9222 localabstract:webview_devtools_remote_38532
```
> **说明:**
>
> "webview_devtools_remote_" åŽé¢çš„æ•°å—,代表ArkWeb所在应用的进程å·ï¼Œ 该数å—ä¸æ˜¯å›ºå®šçš„。请将数å—改为自己查询到的值。
> 如果应用的进程å·å‘生å˜åŒ–(例如,应用é‡æ–°å¯åŠ¨ï¼‰ï¼Œåˆ™éœ€è¦é‡æ–°è¿›è¡Œç«¯å£è½¬å‘。
命令执行æˆåŠŸç¤ºæ„图:
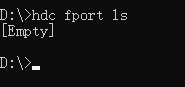
3. 在命令行里执行如下命令,检查端å£æ˜¯å¦è½¬å‘æˆåŠŸã€‚
```shell
hdc fport ls
```
* 如果有返回端å£è½¬å‘的任务,则说明端å£è½¬å‘æˆåŠŸã€‚
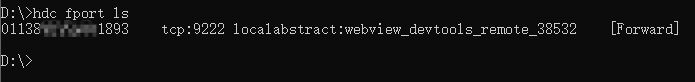
* 如果返回 `[Empty]`, 则说明端å£è½¬å‘失败。
### 在Chromeæµè§ˆå™¨ä¸Šæ‰“开调试工具页é¢
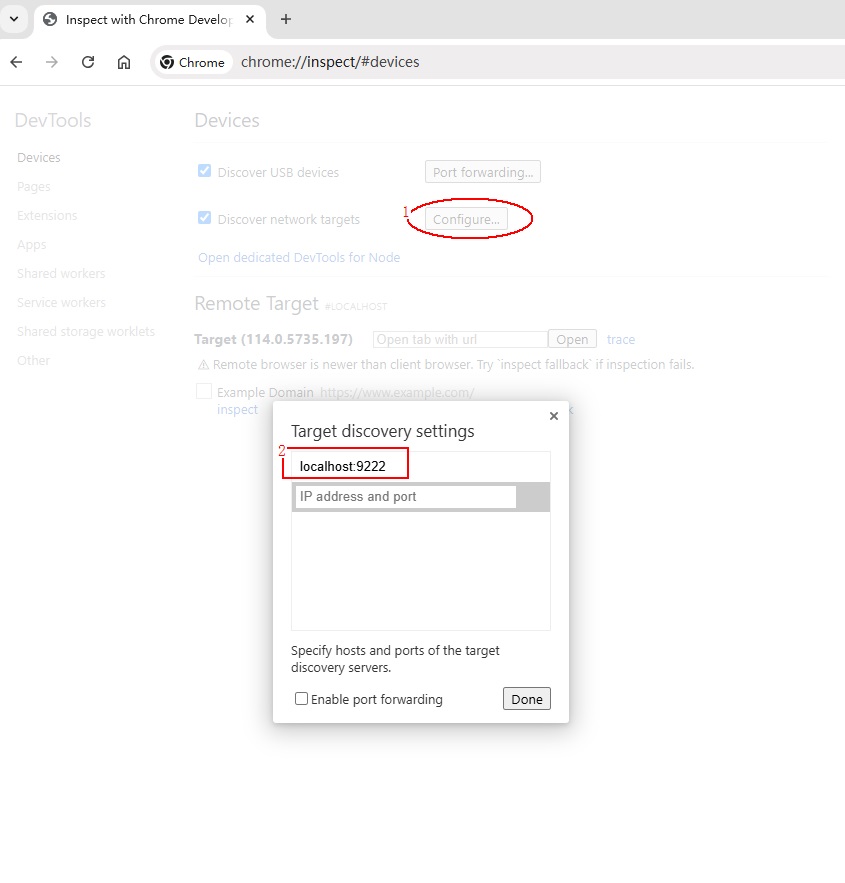
1. 在电脑端Chromeæµè§ˆå™¨åœ°å€æ ä¸è¾“å…¥è°ƒè¯•å·¥å…·åœ°å€ chrome://inspect/\#devices 并打开该页é¢ã€‚
2. 修改Chrome调试工具的é…置。
需è¦ä»Žæœ¬åœ°çš„TCP 9222端å£å‘现被调试网页,所以请确ä¿å·²å‹¾é€‰ "Discover network targets"。然åŽå†è¿›è¡Œç½‘络é…置。
(1) 点击 "Configure" 按钮。
(2) 在 "Target discovery settings" ä¸æ·»åŠ è¦ç›‘å¬çš„本地端å£localhost:9222。
3. 为了åŒæ—¶è°ƒè¯•å¤šä¸ªåº”用,请在Chromeæµè§ˆå™¨çš„调试工具网页内,于“Devicesâ€é€‰é¡¹ä¸çš„“configureâ€éƒ¨åˆ†æ·»åŠ 多个端å£å·ã€‚

### ç‰å¾…å‘现被调试页é¢
如果å‰é¢çš„æ¥éª¤æ‰§è¡ŒæˆåŠŸï¼Œç¨åŽï¼ŒChrome的调试页é¢å°†æ˜¾ç¤ºå¾…调试的网页。

### 开始网页调试

## 便æ·è„šæœ¬
### Windowså¹³å°
请å¤åˆ¶ä»¥ä¸‹ä¿¡æ¯å»ºç«‹bat文件,开å¯è°ƒè¯•åº”用åŽæ‰§è¡Œã€‚
```
@echo off
setlocal enabledelayedexpansion
:: Initialize port number and PID list
set PORT=9222
set PID_LIST=
:: Get the list of all forwarded ports and PIDs
for /f "tokens=2,5 delims=:_" %%a in ('hdc fport ls') do (
if %%a gtr !PORT! (
set PORT=%%a
)
for /f "tokens=1 delims= " %%c in ("%%b") do (
set PID_LIST=!PID_LIST! %%c
)
)
:: Increment port number for next application
set temp_PORT=!PORT!
set /a temp_PORT+=1
set PORT=!temp_PORT!
:: Get the domain socket name of devtools
for /f "tokens=*" %%a in ('hdc shell "cat /proc/net/unix | grep devtools"') do (
set SOCKET_NAME=%%a
:: Extract process ID
for /f "delims=_ tokens=4" %%b in ("!SOCKET_NAME!") do set PID=%%b
:: Check if PID already has a mapping
echo !PID_LIST! | findstr /C:" !PID! " >nul
if errorlevel 1 (
:: Add mapping
hdc fport tcp:!PORT! localabstract:webview_devtools_remote_!PID!
if errorlevel 1 (
echo Error: Failed to add mapping.
pause
exit /b
)
:: Add PID to list and increment port number for next application
set PID_LIST=!PID_LIST! !PID!
set temp_PORT=!PORT!
set /a temp_PORT+=1
set PORT=!temp_PORT!
)
)
:: If no process ID was found, prompt the user to open debugging in their application code and provide the documentation link
if "!SOCKET_NAME!"=="" (
echo No process ID was found. Please open debugging in your application code using the corresponding interface. You can find the relevant documentation at this link: [https://gitee.com/openharmony/docs/blob/master/zh-cn/application-dev/web/web-debugging-with-devtools.md]
pause
exit /b
)
:: Check mapping
hdc fport ls
echo.
echo Script executed successfully. Press any key to exit...
pause >nul
:: Try to open the page in Edge
start msedge chrome://inspect/#devices.com
:: If Edge is not available, then open the page in Chrome
if errorlevel 1 (
start chrome chrome://inspect/#devices.com
)
endlocal
```
### Linux或Macå¹³å°
请å¤åˆ¶ä»¥ä¸‹ä¿¡æ¯å»ºç«‹sh文件,注æ„chmod以åŠæ ¼å¼è½¬æ¢ï¼Œå¼€å¯è°ƒè¯•åº”用åŽæ‰§è¡Œã€‚
```
#!/bin/bash
# Get current fport rule list
CURRENT_FPORT_LIST=$(hdc fport ls)
# Delete the existing fport rule one by one
while IFS= read -r line; do
# Extract the taskline
IFS=' ' read -ra parts <<< "$line"
taskline="${parts[1]} ${parts[2]}"
# Delete the corresponding fport rule
echo "Removing forward rule for $taskline"
hdc fport rm $taskline
result=$?
if [ $result -eq 0 ]; then
echo "Remove forward rule success, taskline:$taskline"
else
echo "Failed to remove forward rule, taskline:$taskline"
fi
done <<< "$CURRENT_FPORT_LIST"
# Initial port number
INITIAL_PORT=9222
# Get the current port number, use initial port number if not set previously
CURRENT_PORT=${PORT:-$INITIAL_PORT}
# Get the list of all PIDs that match the condition
PID_LIST=$(hdc shell cat /proc/net/unix | grep webview_devtools_remote_ | awk -F '_' '{print $NF}')
if [ -z "$PID_LIST" ]; then
echo "Failed to retrieve PID from the device"
exit 1
fi
# Increment the port number
PORT=$CURRENT_PORT
# Forward ports for each application one by one
for PID in $PID_LIST; do
# Increment the port number
PORT=$((PORT + 1))
# Execute the hdc fport command
hdc fport tcp:$PORT localabstract:webview_devtools_remote_$PID
# Check if the command executed successfully
if [ $? -ne 0 ]; then
echo "Failed to execute hdc fport command"
exit 1
fi
done
# List all forwarded ports
hdc fport ls
```
## 常è§é—®é¢˜ä¸Žè§£å†³æ–¹æ³•
### hdcæ— æ³•å‘现设备
**问题现象**
在命令行里执行如下命令åŽï¼Œæ²¡æœ‰åˆ—出设备ID。
```shell
hdc list targets
```
**解决方法**
* 请确ä¿è®¾å¤‡ä¸Šçš„USB调试开关已开å¯ã€‚
* 请确ä¿è®¾å¤‡ä¸Žç”µè„‘相连。
### hdc的命令显示设备"未授æƒ"或"unauthorized"
**问题现象**
执行hdc命令时,æ示设备"未授æƒ"或"unauthorized"。
**é—®é¢˜åŽŸå› **
设备没有授æƒè¯¥å°ç”µè„‘进行调试。
**解决方法**
å¼€å¯USB调试开关的设备连接没有授æƒçš„电脑åŽï¼Œä¼šå¼¹æ¡†æ示"是å¦å…许USB调试?",请选择å…许。
### 找ä¸åˆ°DevToolsçš„domain socket
**问题现象**
在hdc shell里执行如下命令åŽï¼Œæ²¡æœ‰ç»“果。
```shell
cat /proc/net/unix | grep devtools
```
**解决方法**
* 请确ä¿åº”用[å¼€å¯äº†Web调试开关](#应用代ç å¼€å¯web调试开关)。
* 请确ä¿åº”用使用Webç»„ä»¶åŠ è½½äº†ç½‘é¡µã€‚
### 端å£è½¬å‘ä¸æˆåŠŸ
**问题现象**
在命令行里执行如下命令åŽï¼Œæ²¡æœ‰åˆ—出之å‰è®¾ç½®è¿‡è½¬å‘任务。
```shell
hdc fport ls
```
**解决方法**
* 请确ä¿è®¾å¤‡é‡Œçš„domain socketå˜åœ¨ã€‚
* 请确ä¿ç”µè„‘端的tcp:9222没有被å 用。
如果tcp:9222被å 用,å¯ä»¥å°†domain socket转å‘到其他未被å 用的TCP端å£ï¼Œ 比如9223ç‰ã€‚
如果转å‘到了新的TCP端å£ï¼Œ 需è¦åŒæ¥ä¿®æ”¹ç”µè„‘端Chromeæµè§ˆå™¨"Target discovery settings"ä¸çš„端å£å·ã€‚
### 端å£è½¬å‘æˆåŠŸåŽï¼Œç”µè„‘端Chromeæ— æ³•å‘现被调试网页
**问题现象**
电脑端Chromeæµè§ˆå™¨æ— 法å‘现被调试网页。
**é—®é¢˜åŽŸå› **
端å£è½¬å‘失效å¯èƒ½æ˜¯ä»¥ä¸‹åŽŸå› :
* 设备与电脑æ–连,会导致hdc里的所有转å‘任务被清空。
* hdcæœåŠ¡é‡å¯ï¼Œä¹Ÿä¼šå¯¼è‡´hdc里的所有转å‘任务被清空。
* 设备里应用的进程å·å‘生了å˜æ›´ï¼ˆåº”用é‡æ–°å¯åŠ¨ç‰ï¼‰ï¼Œä¼šå¯¼è‡´hdc里旧的转å‘任务失效。
* 多个转å‘任务转å‘到了åŒä¸€ä¸ªç«¯å£ç‰å¼‚常é…置,会导致转å‘异常。
**解决方法**
* 请确ä¿ç”µè„‘端的本地tcp:9222(其他TCP端å£åŒç†ï¼‰æ²¡æœ‰è¢«å 用。
* 请确ä¿è®¾å¤‡ç«¯çš„domain socket还å˜åœ¨ã€‚
* 请确ä¿domain socketå称里的进程å·ä¸Žè¢«è°ƒè¯•çš„应用的进程å·ç›¸åŒã€‚
* è¯·åˆ é™¤hdc里其他ä¸å¿…è¦çš„转å‘任务。
* 转å‘æˆåŠŸåŽï¼Œè¯·ç”¨ç”µè„‘端的Chromeæµè§ˆå™¨æ‰“å¼€ç½‘å€ http://localhost:9222/json ,URL里的9222需è¦æ”¹ä¸ºè‡ªå·±å®žé™…é…置的TCP端å£ã€‚
- 如果网页有内容, 说明端å£è½¬å‘æˆåŠŸï¼Œè¯·åœ¨Chrome的调试页é¢[ç‰å¾…被调试页é¢çš„出现](#ç‰å¾…å‘现被调试页é¢)。

- 如果展示的是错误网页, 说明端å£è½¬å‘失败, 解决方法è§ä¸Šé¢çš„[端å£è½¬å‘ä¸æˆåŠŸ](#端å£è½¬å‘ä¸æˆåŠŸ)。

* 电脑端Chromeæµè§ˆå™¨æ‰“å¼€ http://localhost:9222/json 页é¢æœ‰å†…容,但是Chrome的调试工具界é¢è¿˜æ˜¯æ— 法å‘çŽ°è°ƒè¯•ç›®æ ‡ã€‚
- 请确ä¿Chrome调试工具界é¢çš„ "Configure" ä¸é…置的端å£å·ï¼Œä¸Žç«¯å£è½¬å‘指定的TCP端å£å·ä¸€è‡´ã€‚
- 在本文档ä¸ï¼Œé»˜è®¤ä½¿ç”¨çš„TCP端å£å·ä¸º9222。
如果开å‘者使用了其他的TCP端å£å·(比如9223),请åŒæ—¶ä¿®æ”¹[端å£è½¬å‘](#端å£è½¬å‘)ä¸çš„TCP端å£å·å’Œ[Chrome调试工具界é¢"Configure"é…ç½®](#在chromeæµè§ˆå™¨ä¸Šæ‰“开调试工具页é¢)ä¸çš„端å£å·ã€‚